
LIVE
Weather Demo
Display weather data from Girona using REST integration with grid visualization.
Interactive Demo
View Demo
The most powerful IoT platform for device management, real-time data collection, and intelligent visualization. Transform your business operations today.
Our comprehensive platform provides enterprise-grade device management, real-time data visualization, and advanced analytics. From industrial automation to smart buildings, Visamic delivers the insights you need to optimize operations, reduce costs, and drive innovation.
Monitor your devices and data streams in real-time
Create personalized dashboards for your needs
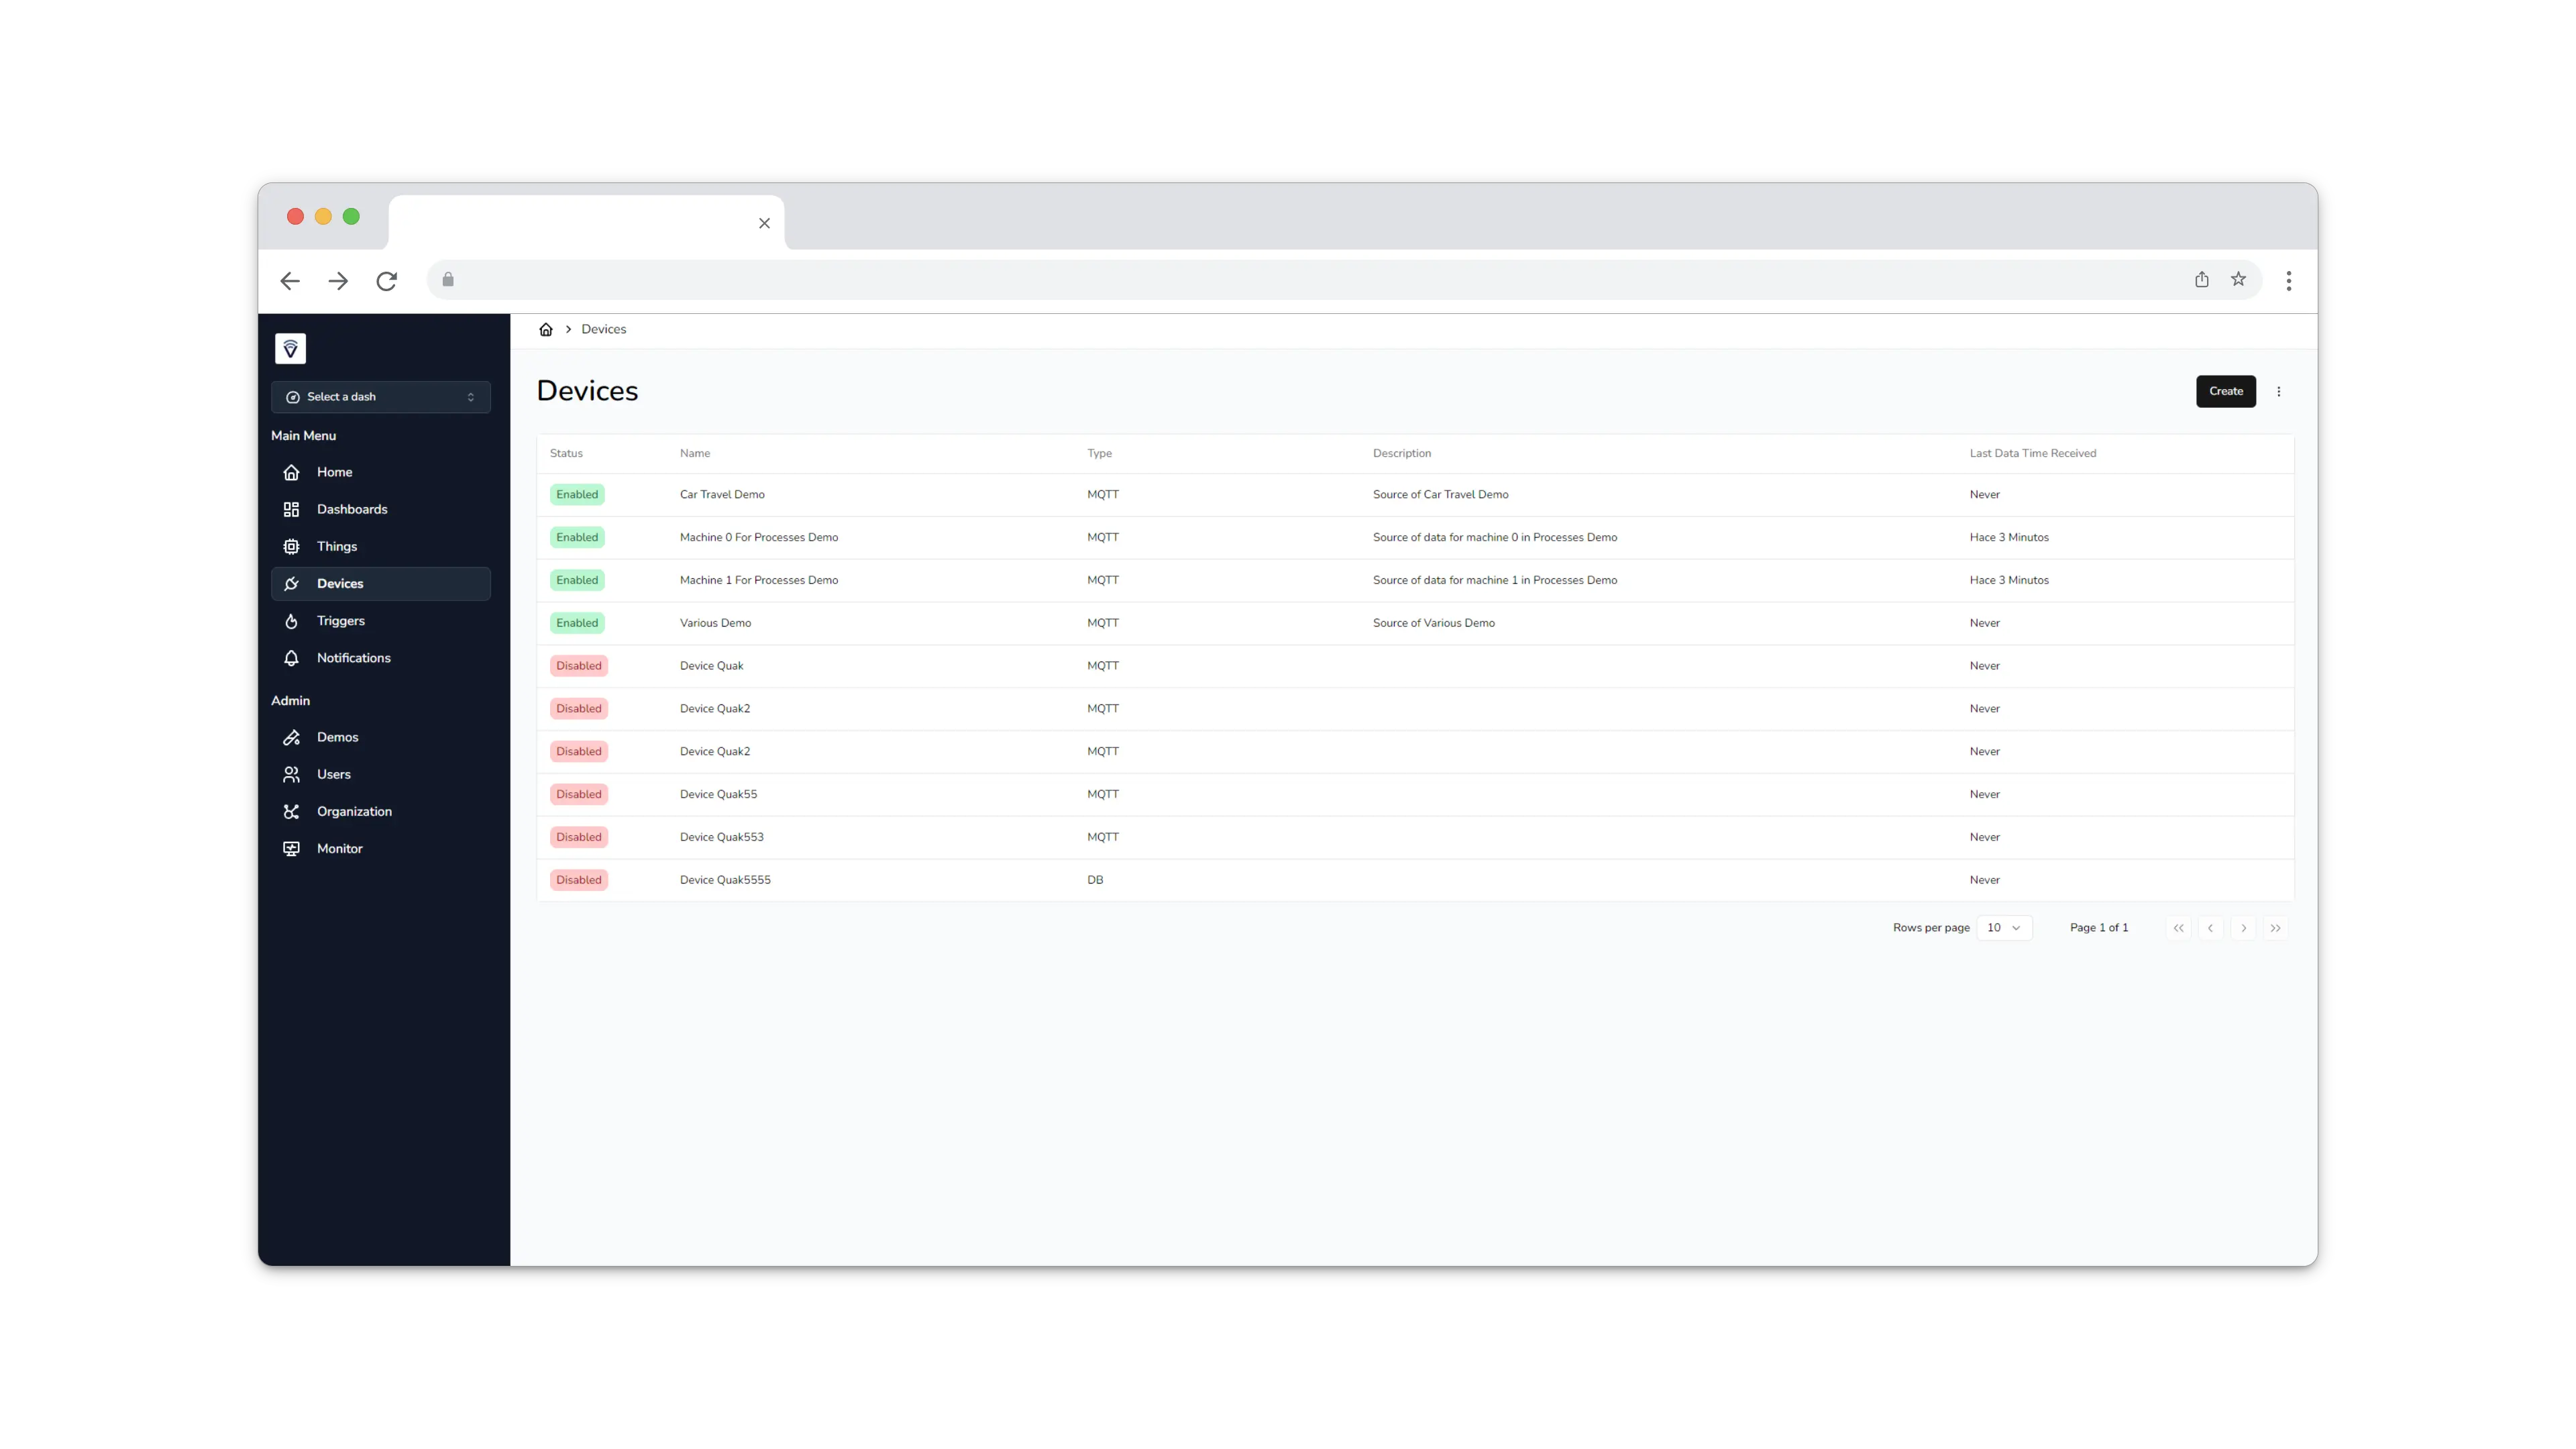
Connect any device with our flexible APIs
Get insights with machine learning capabilities
Bank-level security for your sensitive data
Get help whenever you need it
Create stunning, personalized dashboards that fit your exact needs. With drag-and-drop simplicity and professional-grade customization options, you'll have your perfect workspace in minutes.
Choose from dozens of color themes or create your own
Select from multiple typography options for better readability
Drag and drop widgets to create the perfect layout
Seamlessly integrate any data source with our universal connectivity platform. From legacy systems to cutting-edge sensors, Visamic connects it all.
Real-time messaging protocol for IoT devices
Long-range, low-power wireless communication
Direct database connections and integrations
Discover the comprehensive set of tools and capabilities that make Visamic the perfect choice for your IoT projects
Advanced data analytics and machine learning deliver actionable insights that directly impact your bottom line
Built for scale with 99.9% uptime, supporting millions of data points and thousands of concurrent users
Trusted expertise in data visualization with a proven track record of successful enterprise deployments
Purpose-built for modern manufacturing and industrial processes with real-time monitoring and control
Comprehensive building management with energy optimization, security integration, and occupancy analytics
Connect any device, system, or data source with our flexible APIs and pre-built connectors
Ready to experience these features yourself?
Check out some of the demos we have created for you — Experience the power of Visamic with real data and interactive dashboards.
Loading demos...
Join thousands of companies using Visamic to monitor, analyze, and optimize their IoT infrastructure. Start with our free plan and scale as you grow.
Trusted by 500+ companies worldwide
Display weather data from Girona using REST integration with grid visualization.
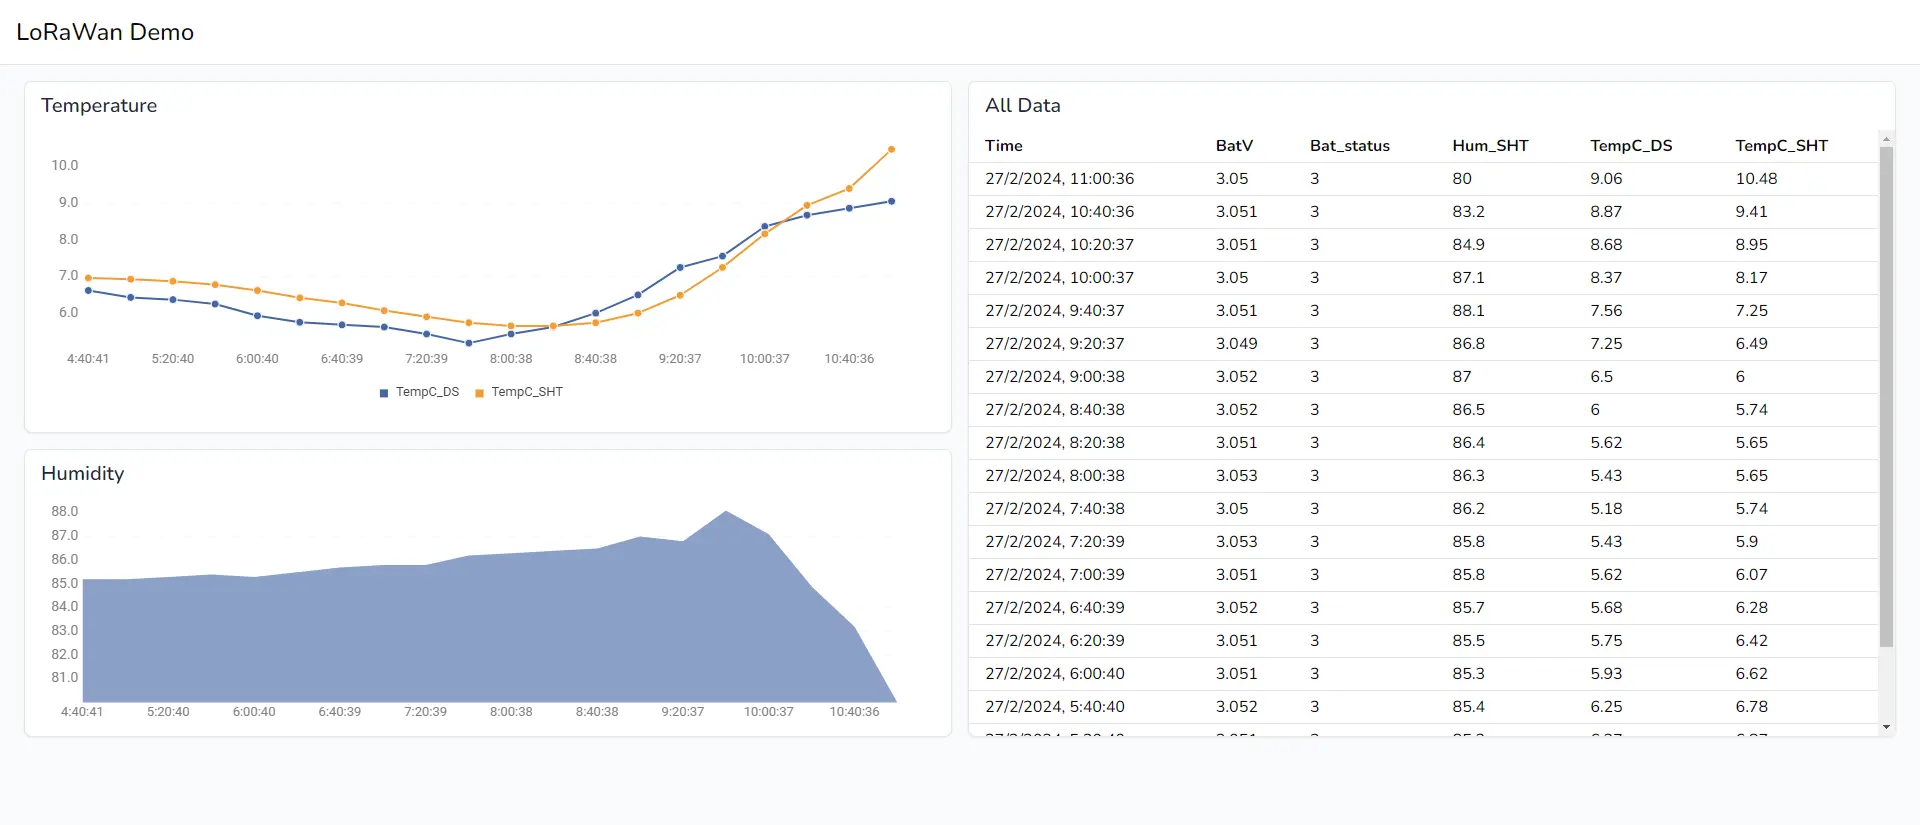
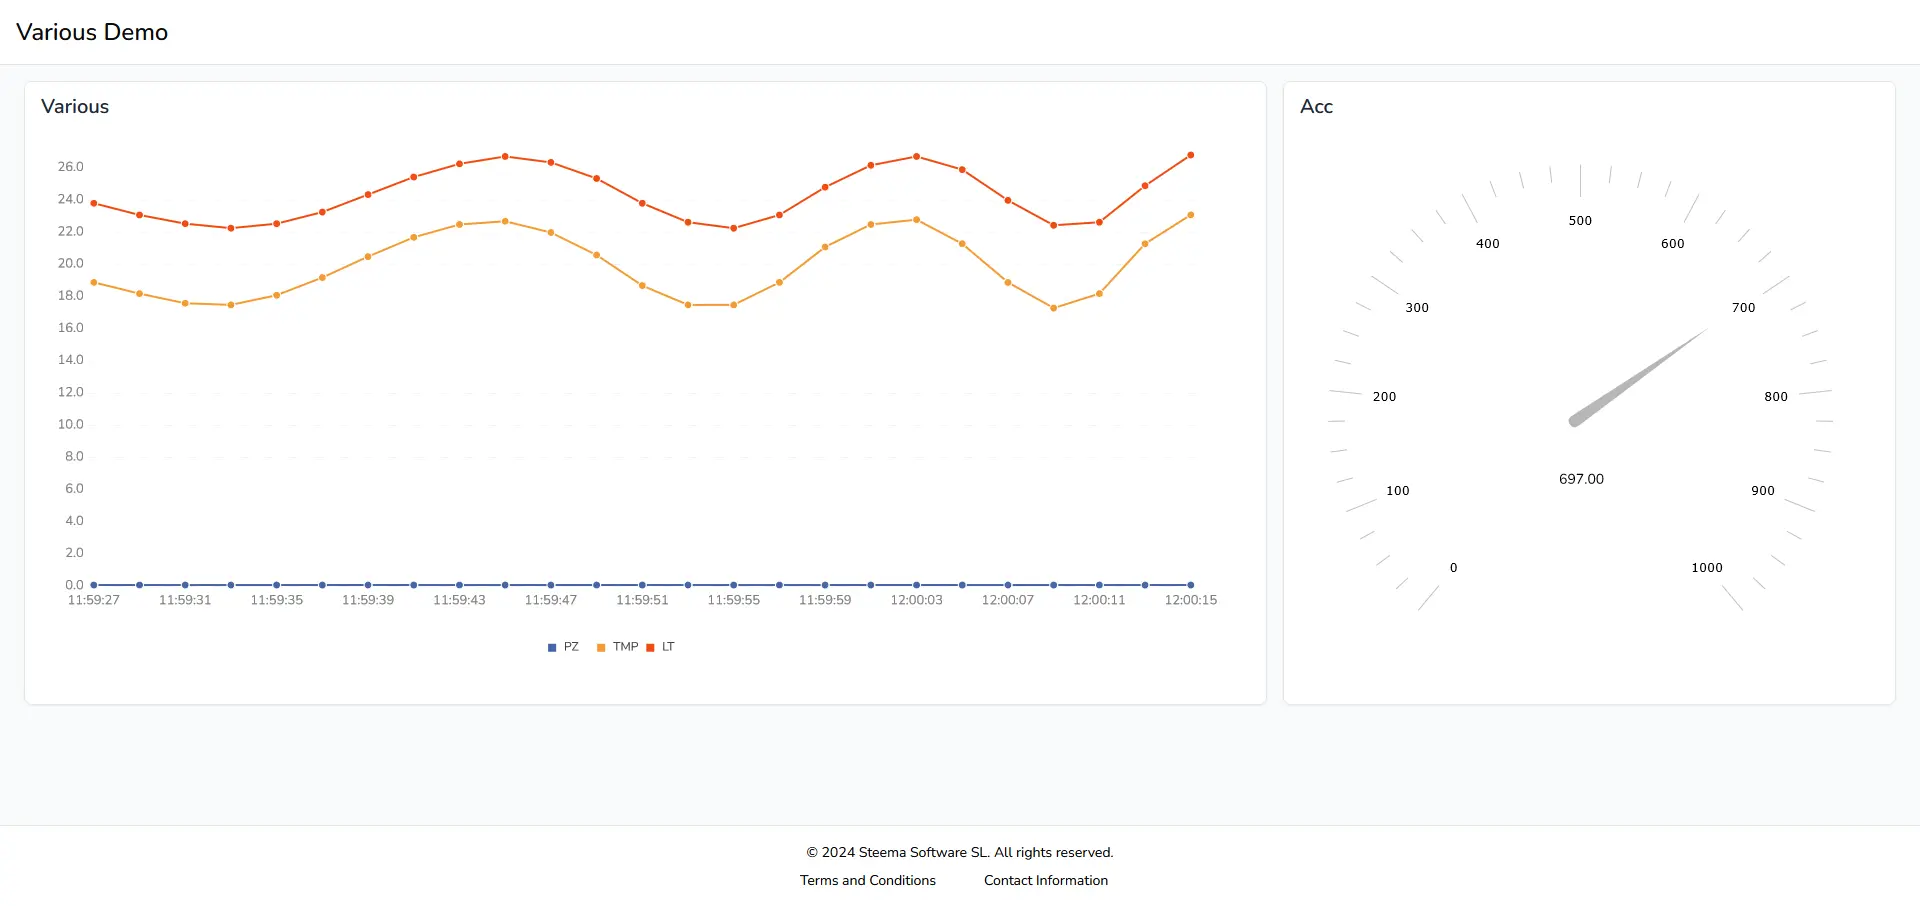
Demo to show different variables that could be monitored from LoRaWAN.
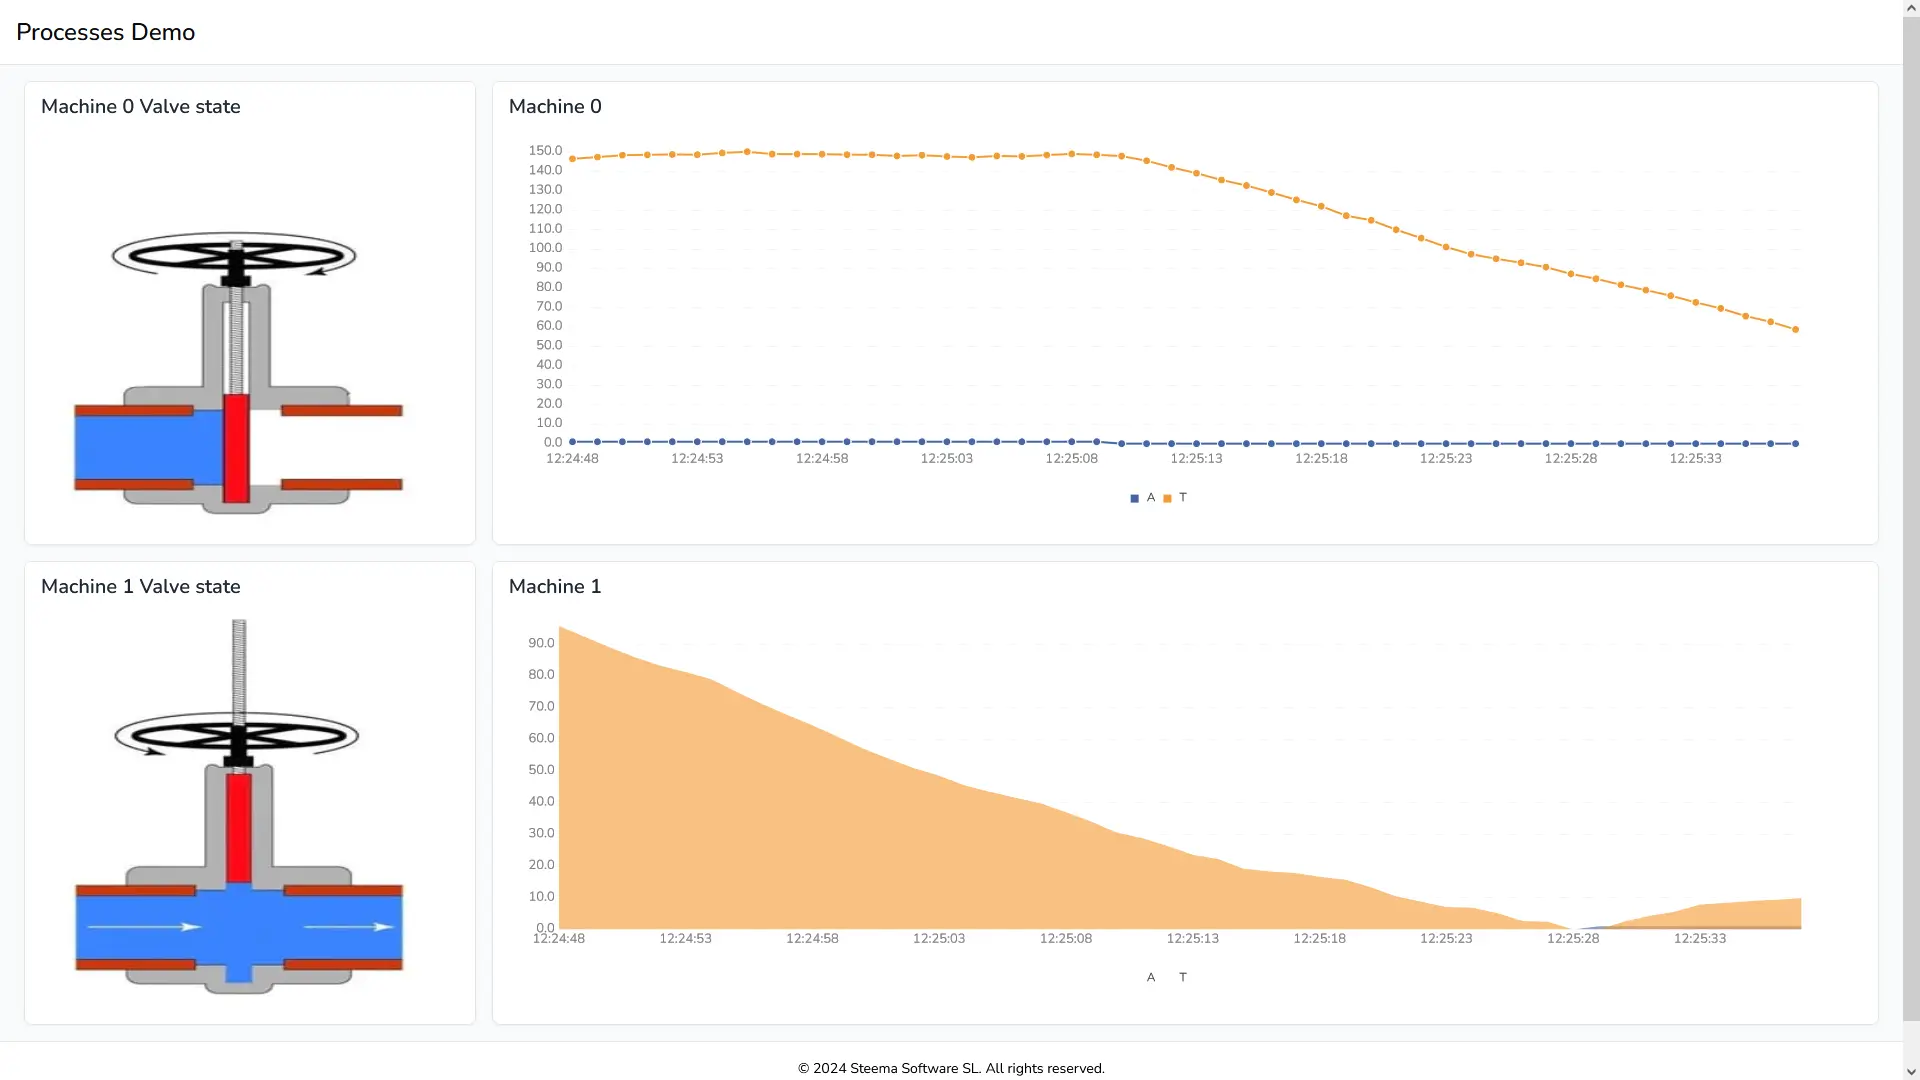
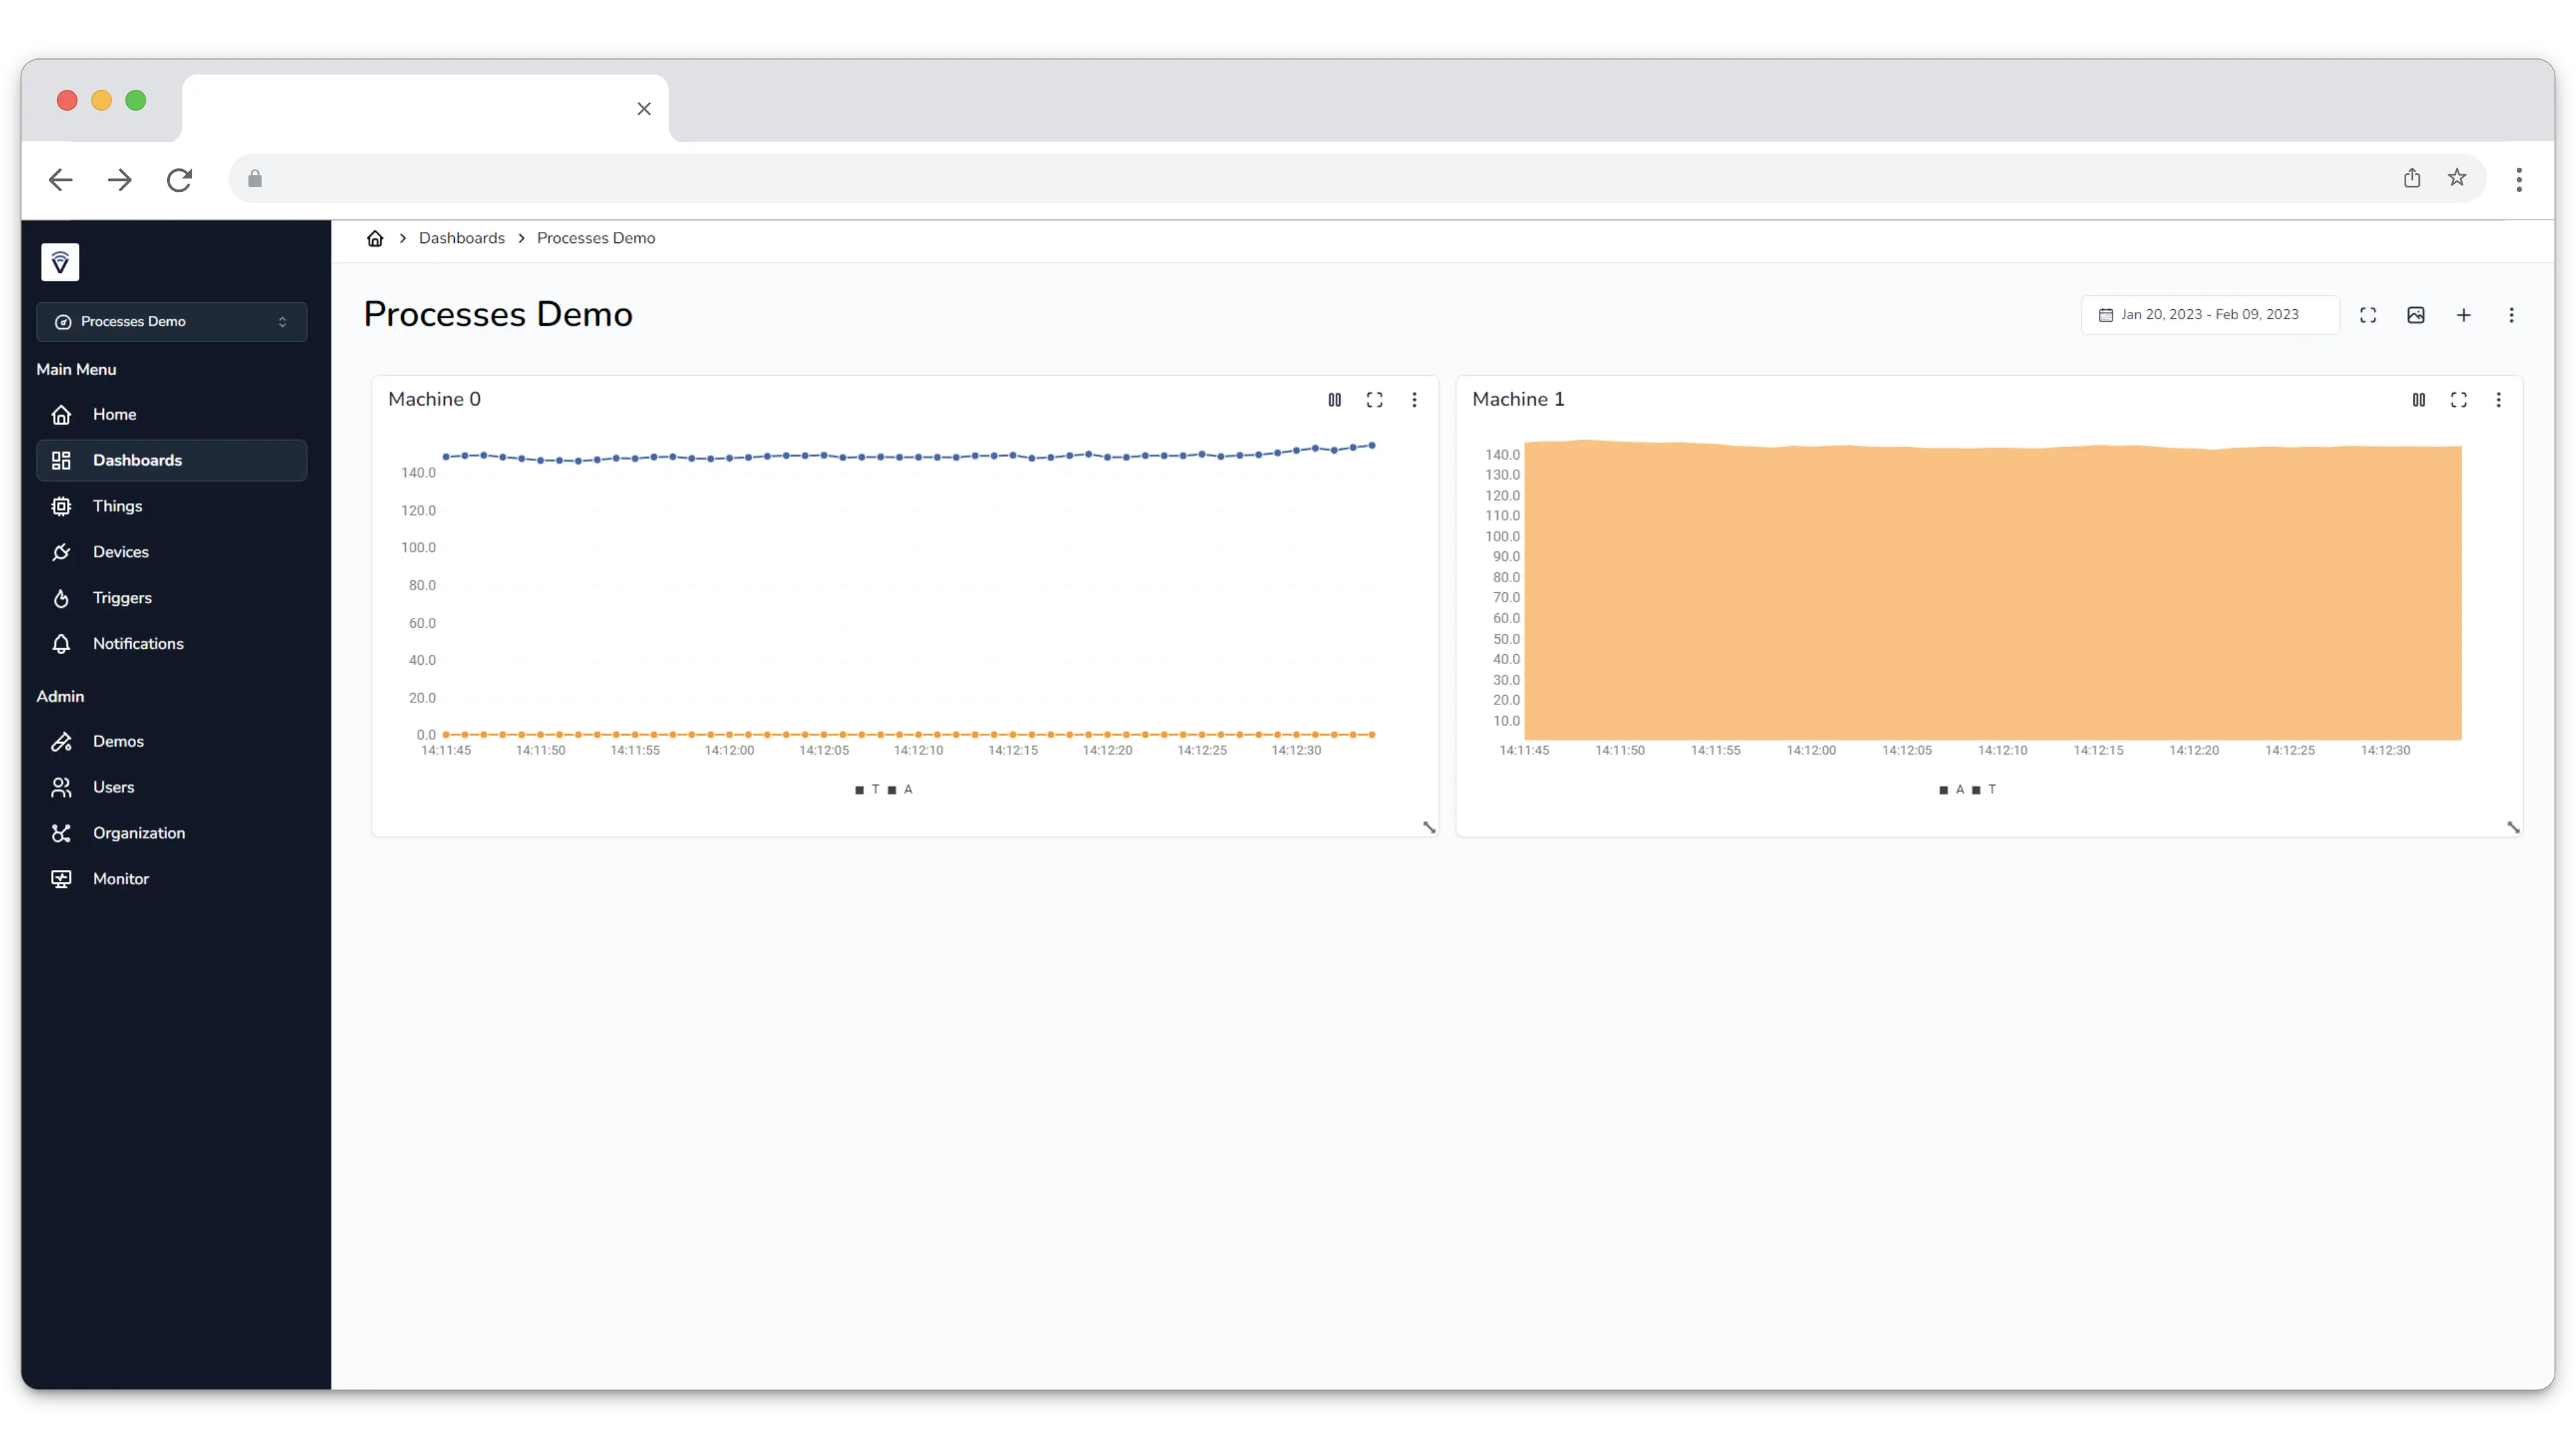
Processing machine statistics.
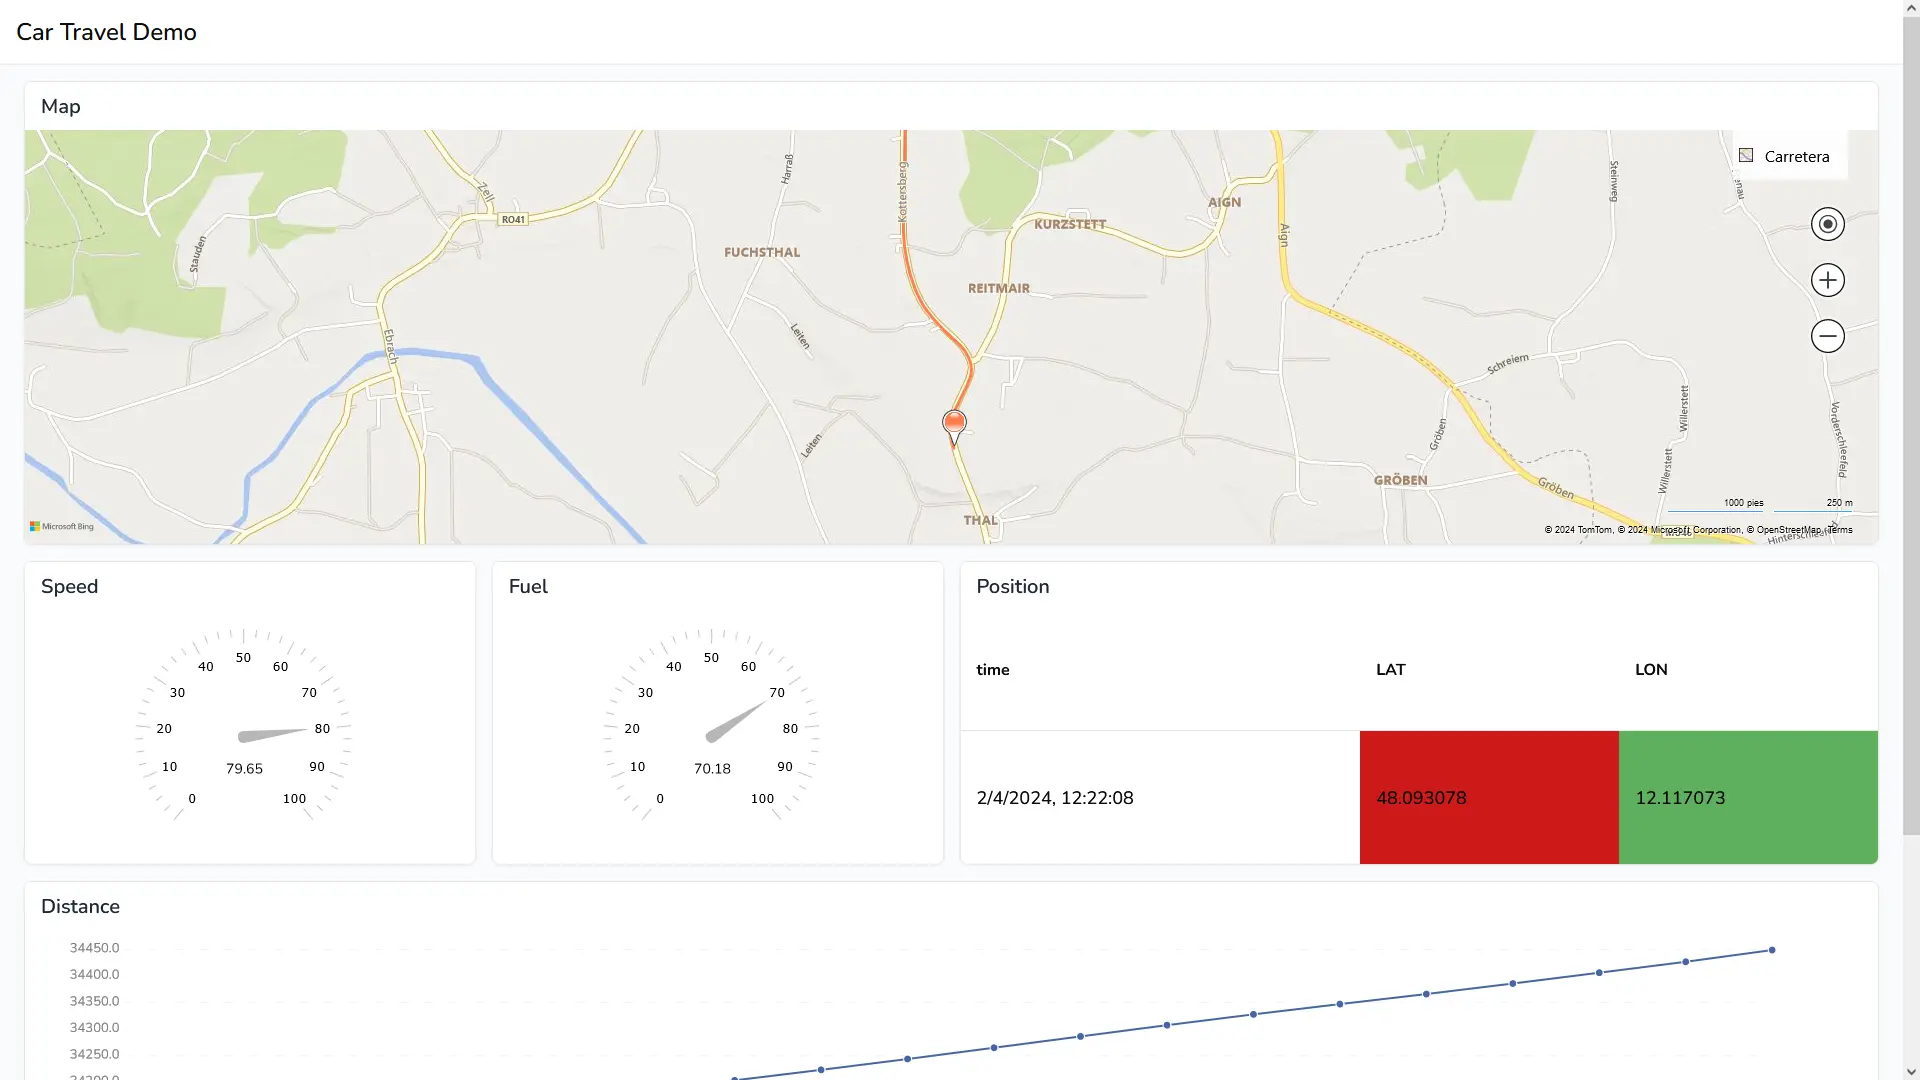
Demo to show different variables that could be monitored from a moving vehicle.
Display data from MongoDB with grid visualization.
Demo to show different variables that could be monitored from an arduino.